The Innovate-Ops Platform

The intelligence layer for industrial operations.

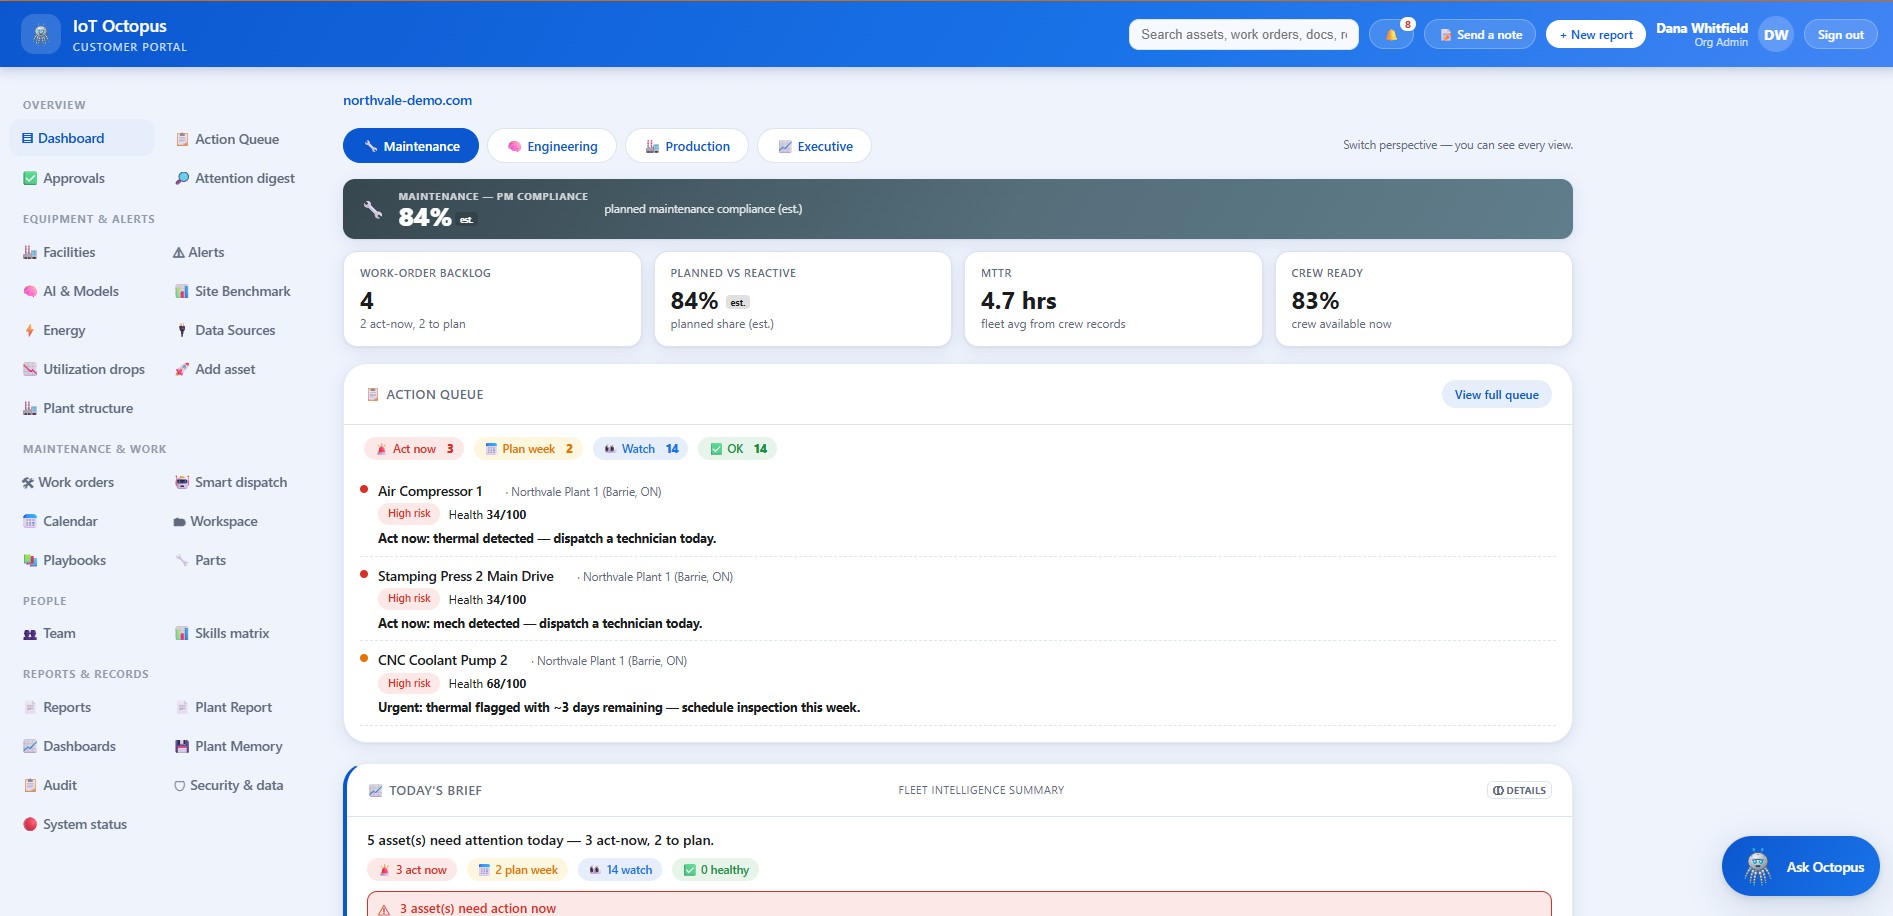
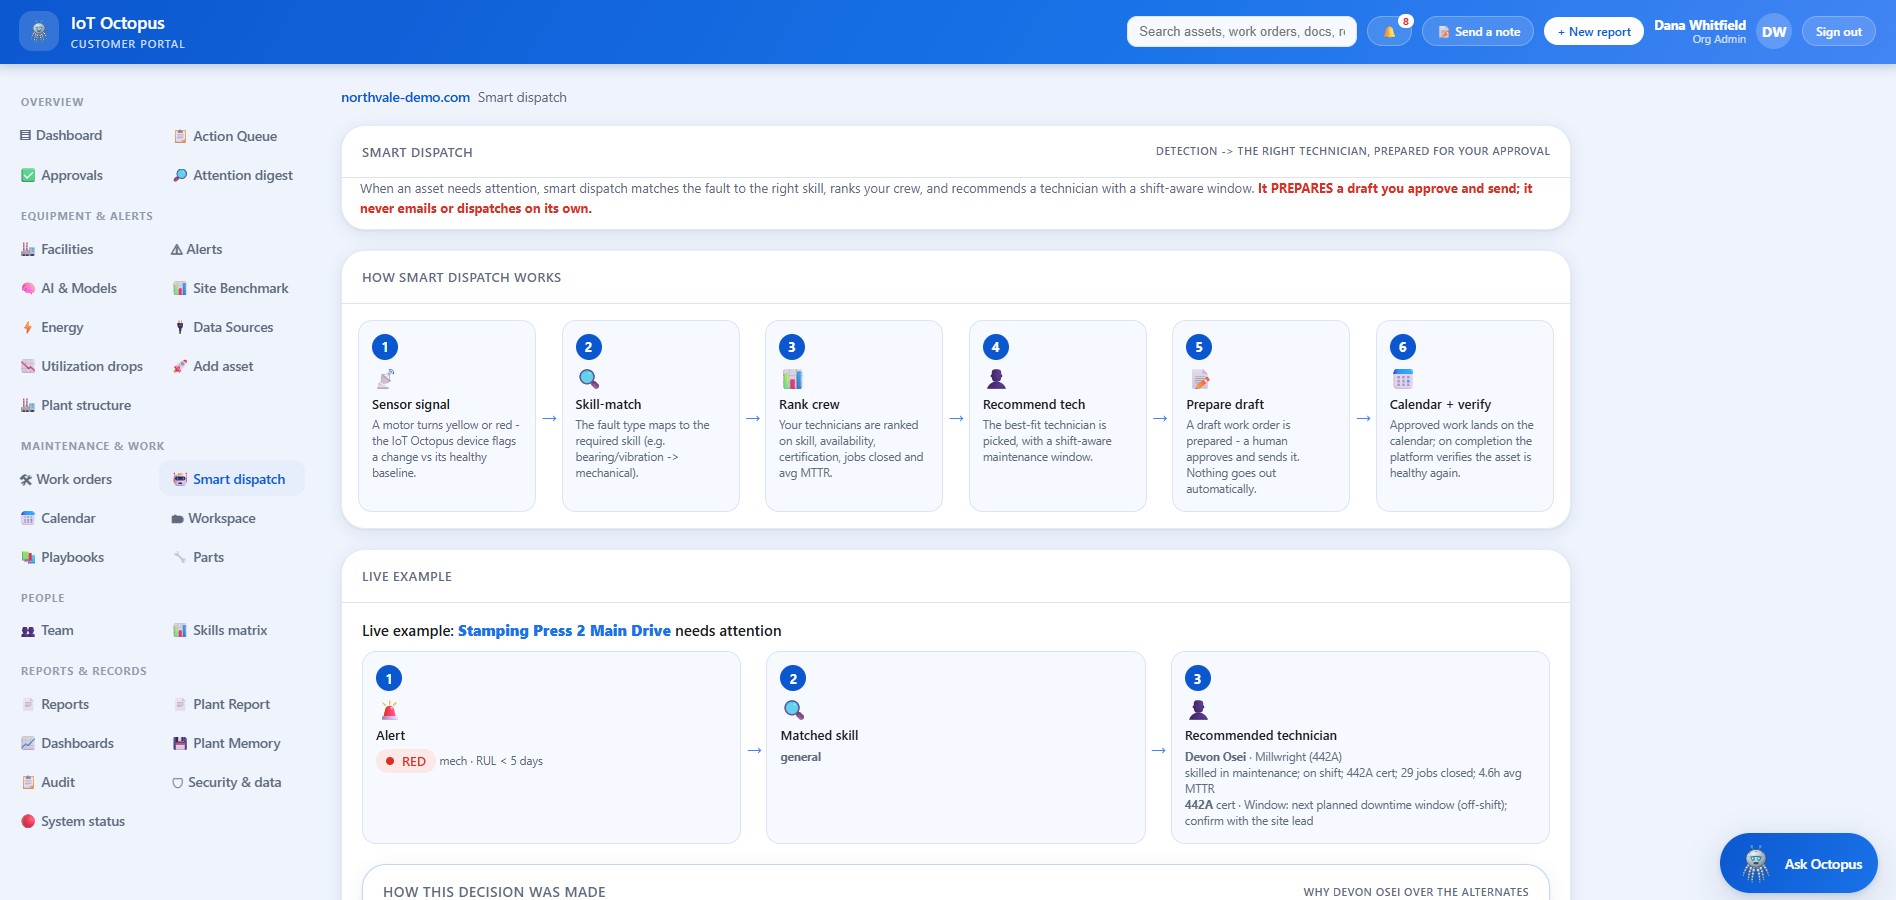
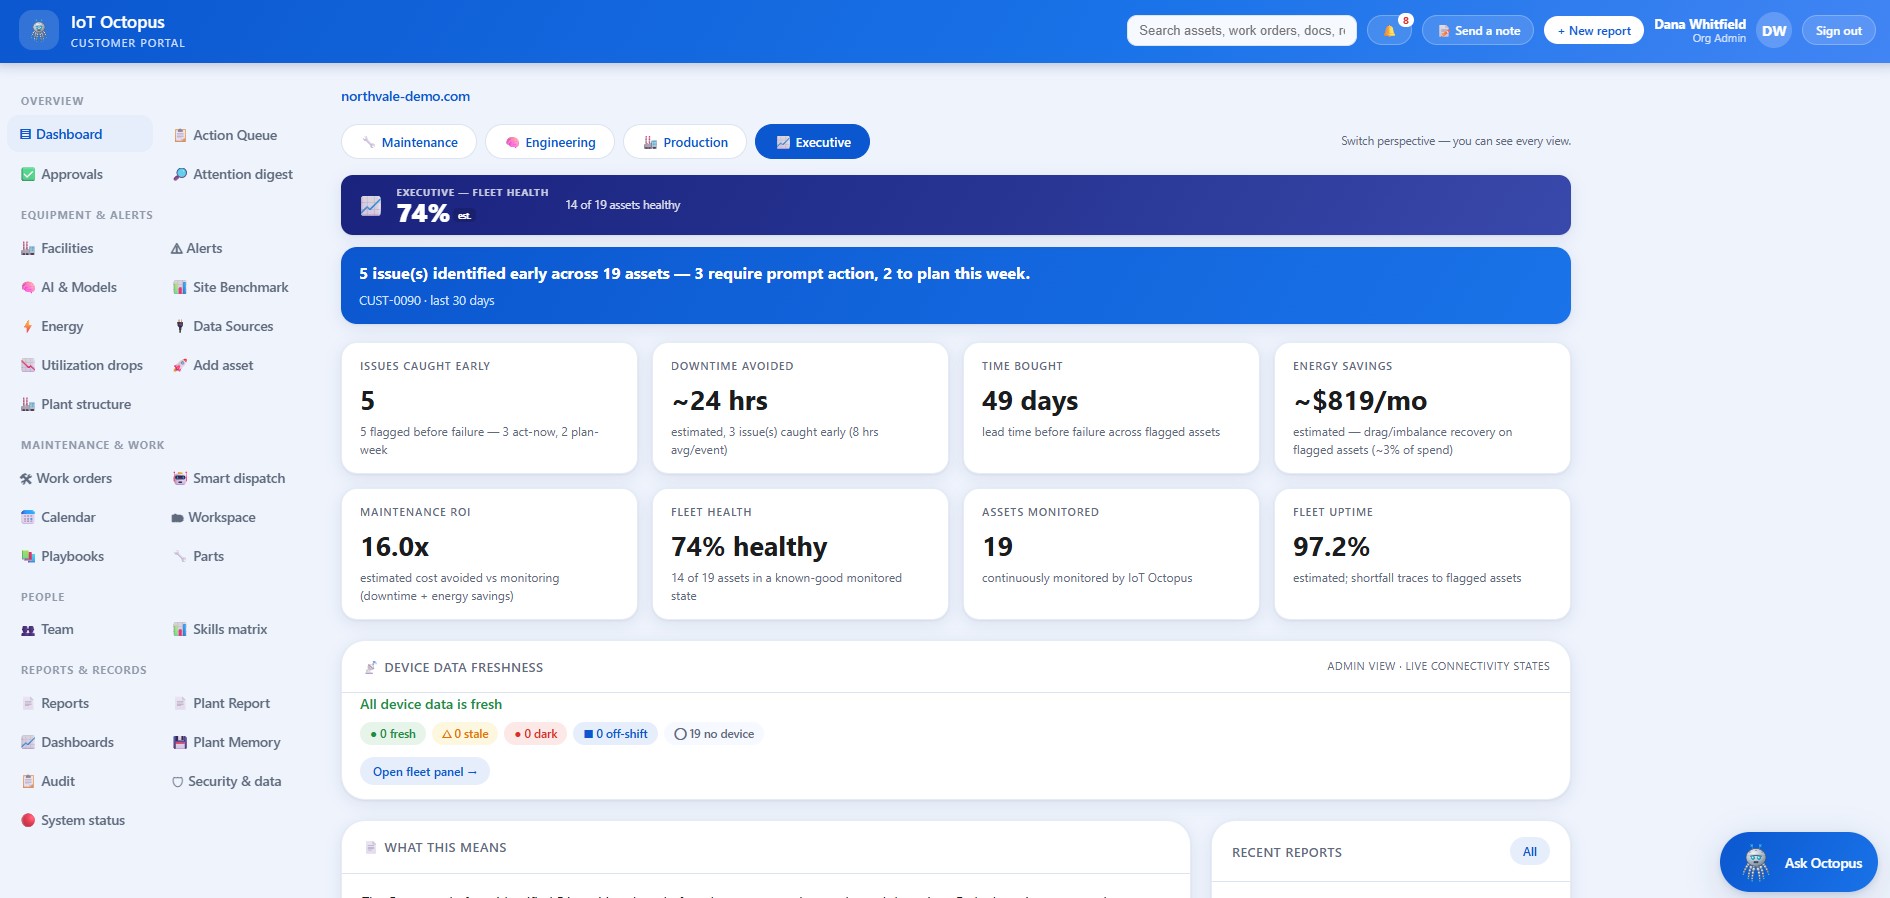
This isn't a dashboard. It's where machine health, operations, energy and AI recommendations come together — so your teams know exactly what's happening across every site, and what to do next. And it starts on day one: a photo of a machine's nameplate gives the platform a physics-based baseline immediately — no waiting for failure history.

Watch it work

See the platform in action (2 min)

A short walkthrough of the IoT Octopus customer portal — equipment health, operations, energy and AI recommendations in one place.

Sample dashboard shown · sample data.

One place, six jobs done

What the portal brings together

Every signal from your equipment becomes a decision someone can act on — health, operations, energy, recommendations, maintenance and reporting in a single view.

Equipment Health

Live health state and remaining-life signals for every critical asset, so problems surface before they become downtime.

  • Green / watch / action status at a glance
  • Trends that show wear building over time
  • An Equipment Passport per machine

Operational Intelligence

Real runtime, utilization and bottlenecks across lines and sites — visibility that drives better operating decisions.

  • Actual uptime, not assumptions
  • Compare assets, lines and facilities
  • One operational view for managers

Energy

Consumption and idle waste at the machine level, made visible — so cost and carbon targets have data behind them.

  • Energy per asset, not just per site
  • Idle and off-shift waste flagged
  • Track progress against reduction goals

AI Recommendations

Plain-language next steps — what to fix, when, and why — instead of raw data your team has to interpret.

  • Prioritized actions, not alert noise
  • Recommended timing to avoid downtime
  • Parts and crew suggested alongside

Maintenance Intelligence

Work orders, parts and crew connected to the asset that needs them — so a recommendation becomes a scheduled job.

  • Alerts arrive as recommended work orders
  • Suggested crew and skills for the job
  • Parts checked and suggested before the truck rolls

Executive Reporting

Reports leadership can read in a minute — fleet health, savings and risk summarized across every site you run.

  • One-page fleet and site rollups
  • Energy and downtime trends over time
  • Shareable summaries on demand
Inside the portal

From signal to decision, on one screen

A maintenance lead opens the portal and sees the fleet at a glance: what's healthy, what to watch, what needs action — and the recommended fix, ready to schedule.

Status that's instantly readable

Green, watch and action across every asset — no spreadsheet hunting.

The next action, spelled out

A recommendation in plain language, with timing and parts attached.

Energy in the same view

Consumption and waste sit beside health — one source of truth.

See a walkthrough Book a Demo
Fleet view · illustrative sample data
AI recommendation
Pump 3 (Line 2): vibration trend indicates early bearing wear. Schedule service within ~2 weeks to avoid unplanned downtime. Suggested crew and parts attached.
Equipment health
Sortation Motor A Healthy
Conveyor Drive 4 Watch
Pump 3 · Line 2 Action
Compressor C1 Healthy
Energy this week
Consumption
4,820 kWh
Idle waste
9%
vs. target
−12%
IoT Octopus maintenance dashboard: action queue, PM compliance and fleet health on one screen
The maintenance dashboard — action queue, work-order backlog and fleet health at a glance. Sample dashboard shown.
AI assistance, built in

Ask the portal a question. Get an answer and a next step.

Ask about any asset, alert or report in plain language — and get a clear answer plus the recommended action. No dashboards to decode, no query language to learn. Just the operating questions your team actually asks.

Behind every answer is organizational memory: the platform remembers every machine, every fix, every decision — institutional knowledge that never retires or walks out the door. And the portal itself is tailored to your operation: your assets, your workflows, your KPIs.

  • "What's wrong with Pump 3 and what should I do?"
  • "Which assets are trending toward failure this month?"
  • "Summarize energy waste across all sites."
Explore AI & Intelligence →
Ask OctopusAlways on · ask anything in plain language — most insights are a question away
What's wrong with Pump 3, and what should I do?
Pump 3 (Line 2) is showing an early bearing-wear pattern in its vibration trend — currently in Action. Recommended: schedule a bearing service within about two weeks to avoid unplanned downtime. The right crew and parts are already suggested, and I can open a work order for you.
Anything else I should watch this week?
Conveyor Drive 4 is in Watch with a slowly rising vibration trend — worth a look at the next planned stop. Everything else on the line is healthy.
Ask about any asset, alert or report…
Send

Illustrative conversation. Sample data only.

IoT Octopus smart dispatch: a detected fault matched to the right skill and recommended technician
Smart dispatch turns a detected fault into a recommended technician, prepared for your approval. Sample dashboard shown.
One product, end to end

One ecosystem, not three tools

The site you're on, the portal your team logs into, and the device on your equipment are built to feel like one product — so data flows from the machine to a decision without stitching anything together.

The public platform

Where you learn what Innovate-Ops does and book a deployment on your most critical asset.

The portal

Where your team works every day — health, operations, energy, recommendations and reports in one place.

The device — and your existing sources

The IoT Octopus on your equipment, plus the data you already have — VFDs, PLCs, instrumentation — feeding the portal the signals that power every insight.

Per-customer data isolationYour equipment data stays yours — kept separate from every other customer.
Multi-site by designOne login spans every facility you run, from a manufacturing site to a national logistics operator.
Built on Google CloudEnterprise-grade reliability and security from the ground up — nothing to host or maintain.
IoT Octopus executive view: fleet health, maintenance ROI, downtime avoided and energy savings
The executive view rolls health into business outcomes — downtime avoided, maintenance ROI and energy savings. Sample dashboard shown.
Trusted foundation

Built on Google Cloud

The portal runs on Google Cloud — so your operations intelligence is secure, reliable and ready to scale across sites without an IT project on your side.

☁️ Built on Google Cloud 🔒 Per-customer data isolation 🏭 Running on live industrial equipment

See IoT Octopus on your equipment

Book a 20-minute demo or deploy on your most critical asset.